Employee Net Promoter Score (eNPS) is a metric used to measure employee loyalty and engagement by assessing how likely employees are to recommend the organization as a place to work.
Creating eNPS Survey
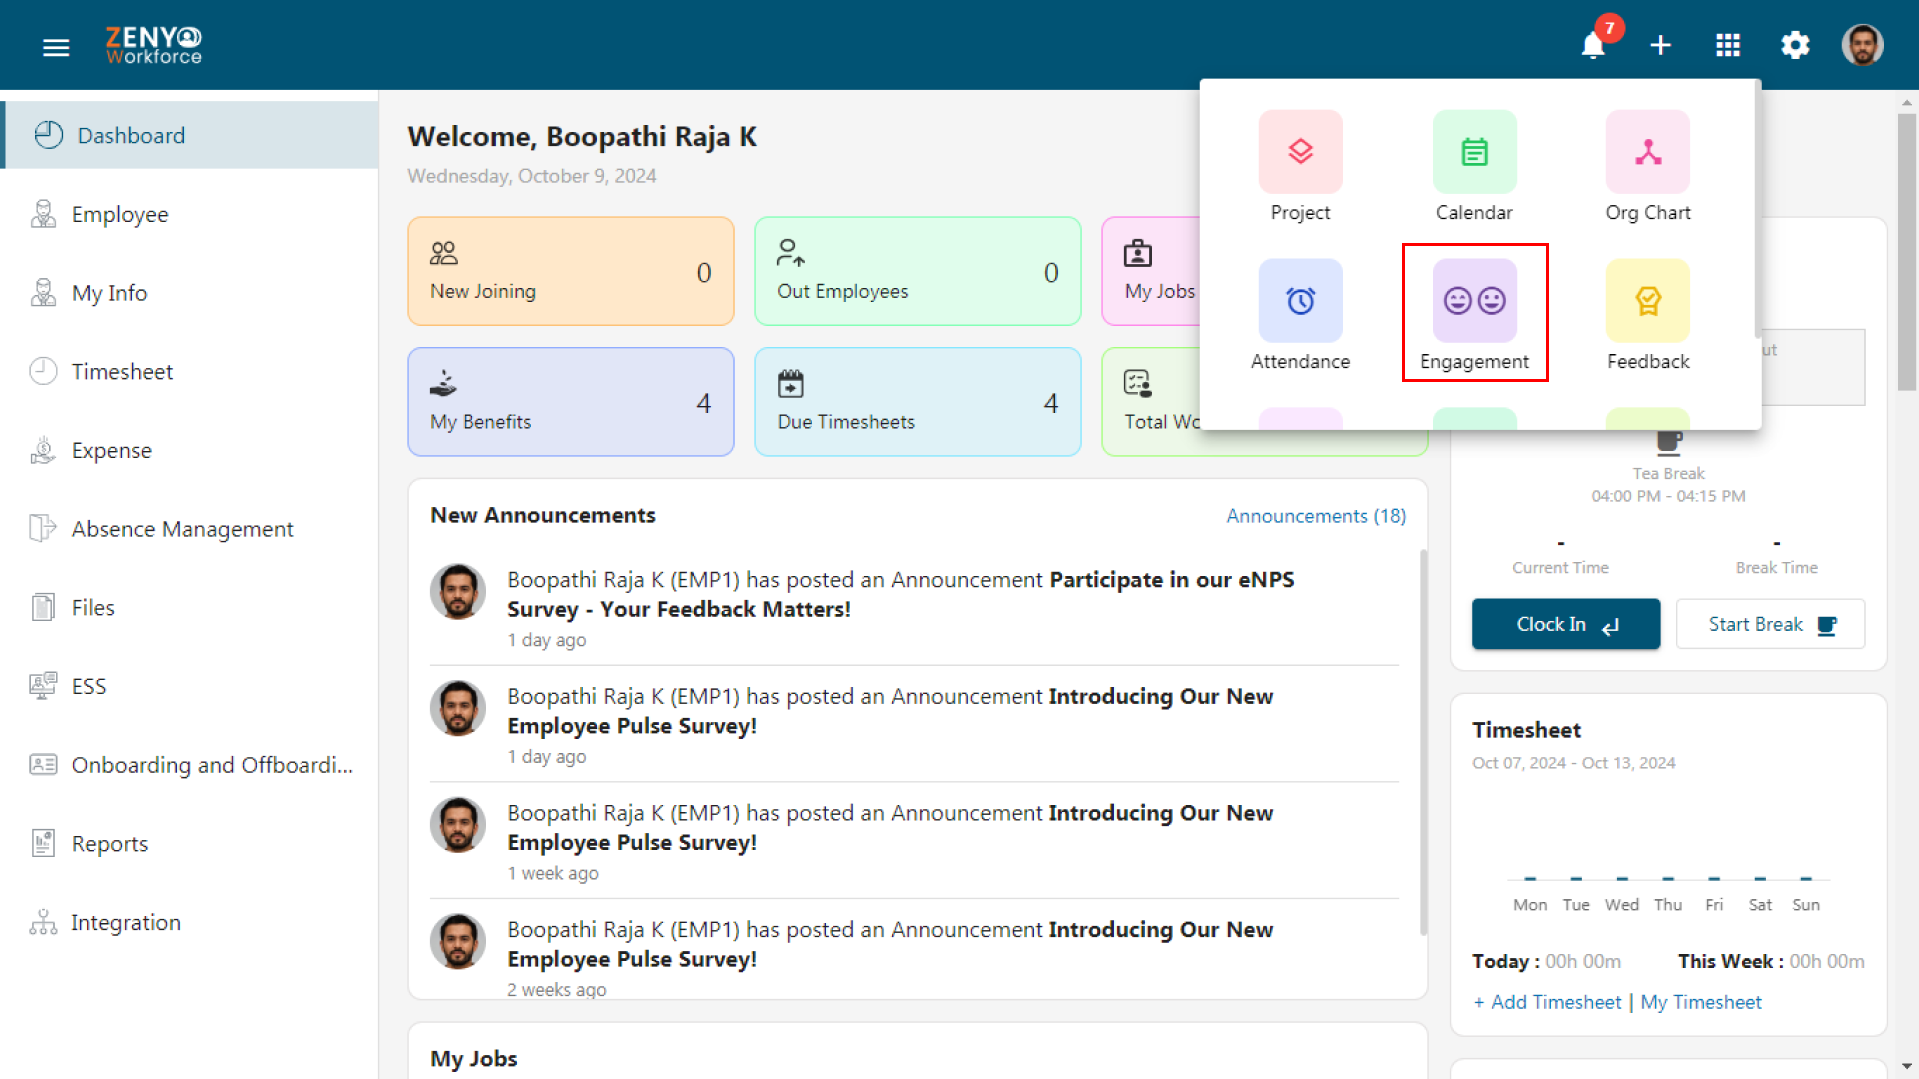
- Click on the App icon and select Engagement.
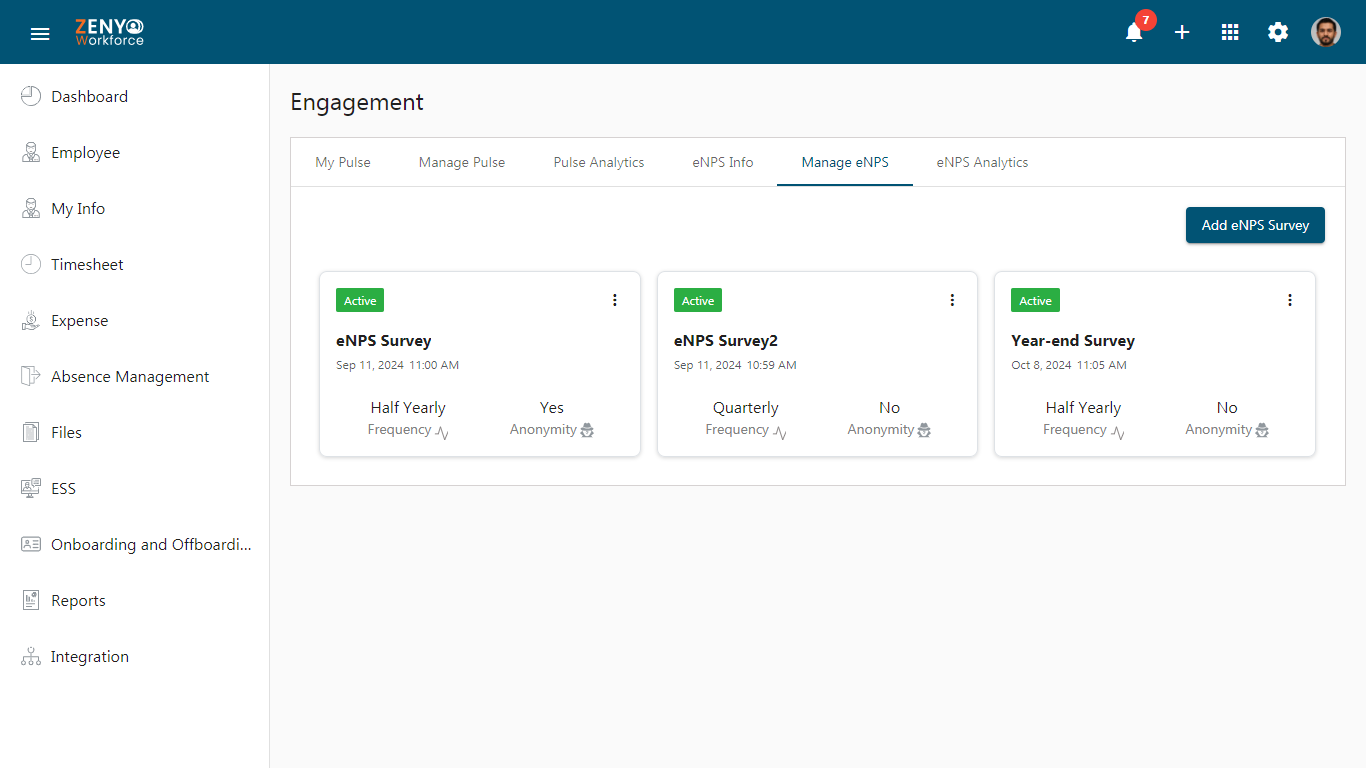
- Click on the Manage eNPS tab to proceed with creating a new survey.
- Click the Add eNPS Survey button.
- On the Create New eNPS page, complete the following fields in the General section.
- Enter a name for your survey, choose a frequency (Quarterly or Half Yearly), select a specific date and time for conducting the survey, and specify the time frame for its completion or expiration.
- Add any necessary details or instructions regarding the survey.

- In the Anonymous and Broadcast Type section, check the Anonymous checkbox if you want to ensure that employees’ names will not be visible during the survey result analysis. This will guarantee 100% anonymity for participants.
- In the Broadcast Type, by default, once the survey is published, it will be visible through Announcement.
- If you want to notify employees and allow them to participate via email, check the Email checkbox. This will send notifications to employees when it is time to participate in the survey.
- You can create your own survey question or select from an existing questionnaire.
- In the Custom Question section, type your question in the provided box.
- You can use the 10-point Rating Scale where scores from 1 to 6 provide negative feedback, 7-8 indicate a neutral response, and 9-10 are considered highly likely.
- You can edit the rating scale options as needed.
- To use a predefined question, click the Select from template button, choose a question, and click the Insert button.
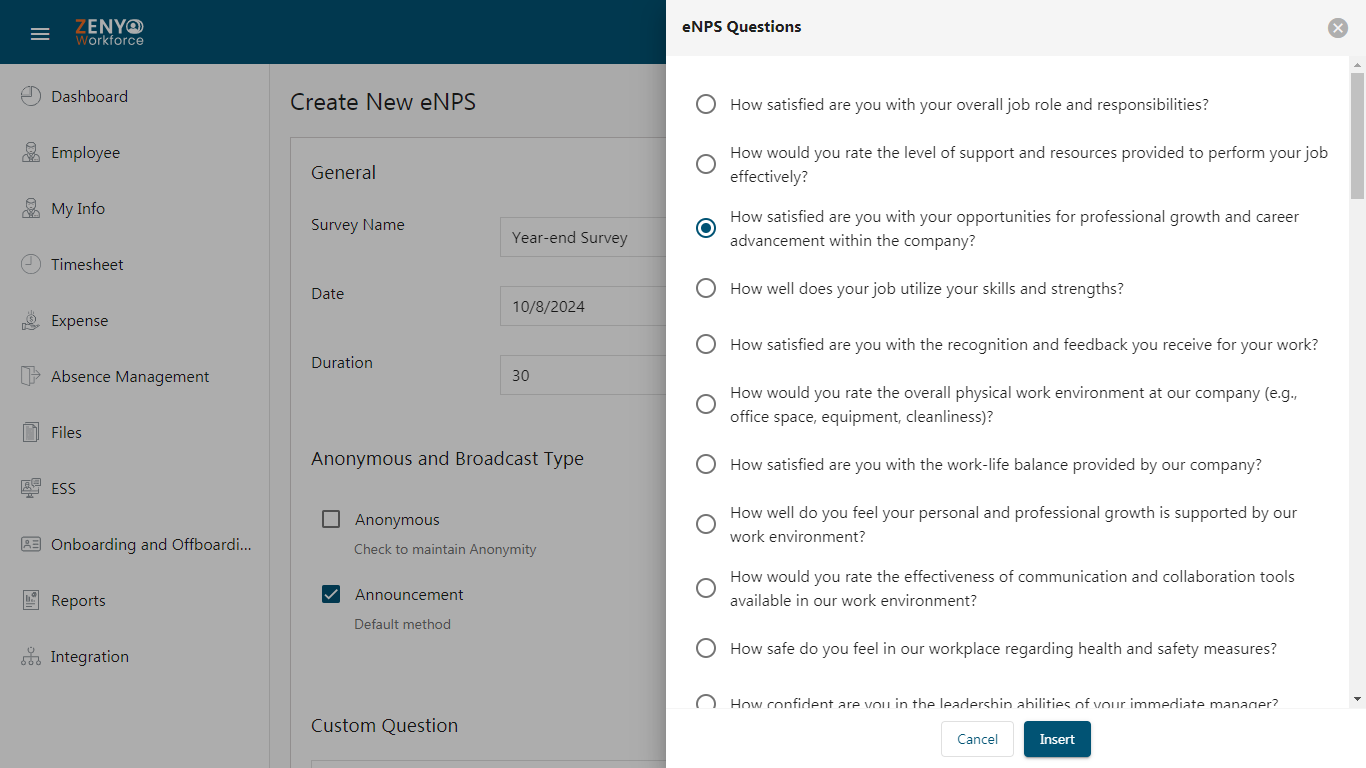
- The selected question will appear in the box under the Existing Question section.
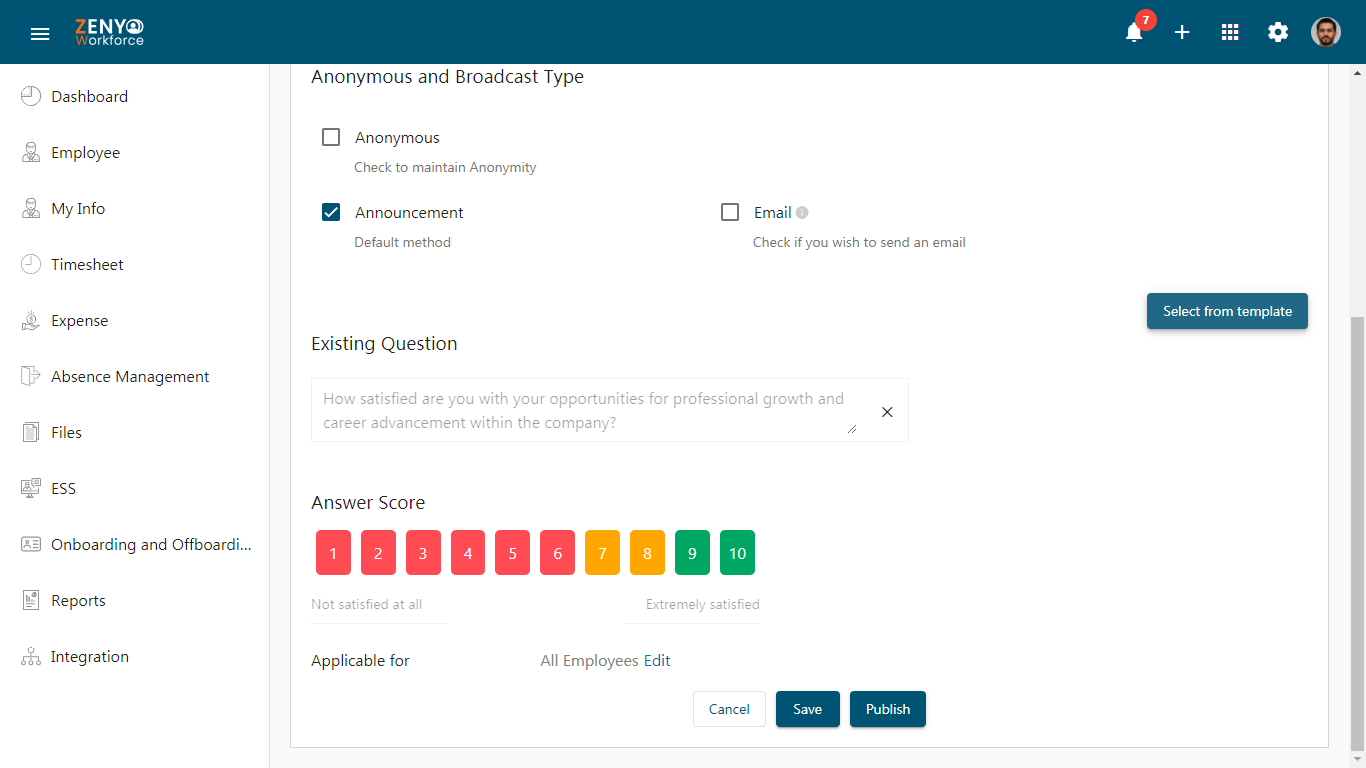
- You can apply the survey to employees using the filter.
- The All Employees option will be selected by default to apply the survey to everyone, or you can select Only Some Employees to target specific individuals. If targeting specific employees, you can select them based on Role, Department, Office Location, and Employment Type.
- After making your selections, click Publish to send the survey to employees for responses, or click Save to save the survey as a draft.
Managing Saved Surveys
- Once saved as a draft, the survey will appear under the Manage eNPS tab with a Draft status.
- The details like Survey Name, Date, Time, Frequency, Status, and Anonymity status will be displayed.
- On clicking the More Options icon, you will have options to:
- Move to Active: Publish the survey by moving it to the active state.
- View: Review the survey details.
- Edit: Make changes to the survey before publishing.
- Delete: Remove the survey.
Note: Once the survey is moved to active and employees have responded, deletion will no longer be possible.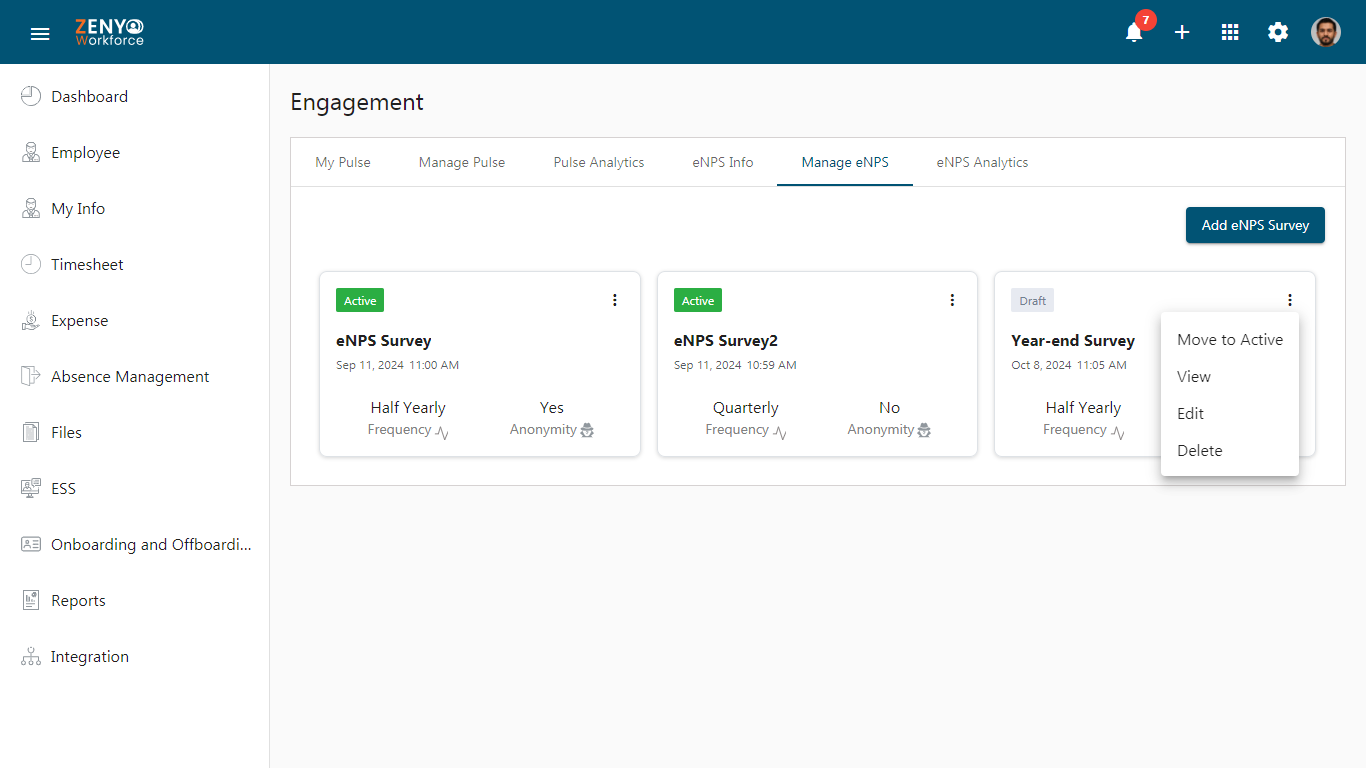
- After moving the survey to Active status, you can move it to Inactive status or view the details.
Employee eNPS Survey
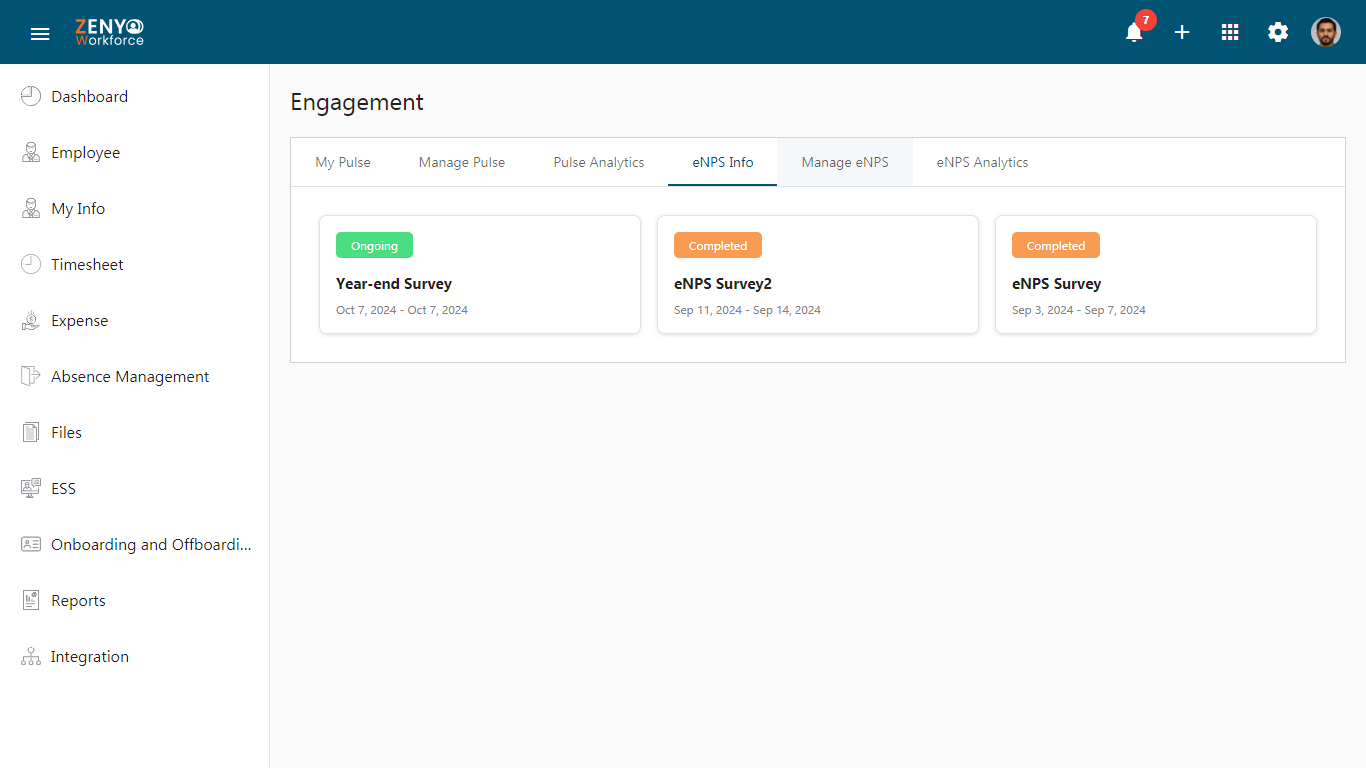
- The published survey will appear under the eNPS Info tab for employees, along with the Survey Name and Duration.
- Employees can start taking the survey by clicking on it.
- The survey will display the Survey Name at the top, followed by the question with a 10-point scale rating.
- After providing a rating, employees can add a comment in the box below to explain their rating, which can be used for sentiment analysis.
- Once finished, employees can click the Submit button.
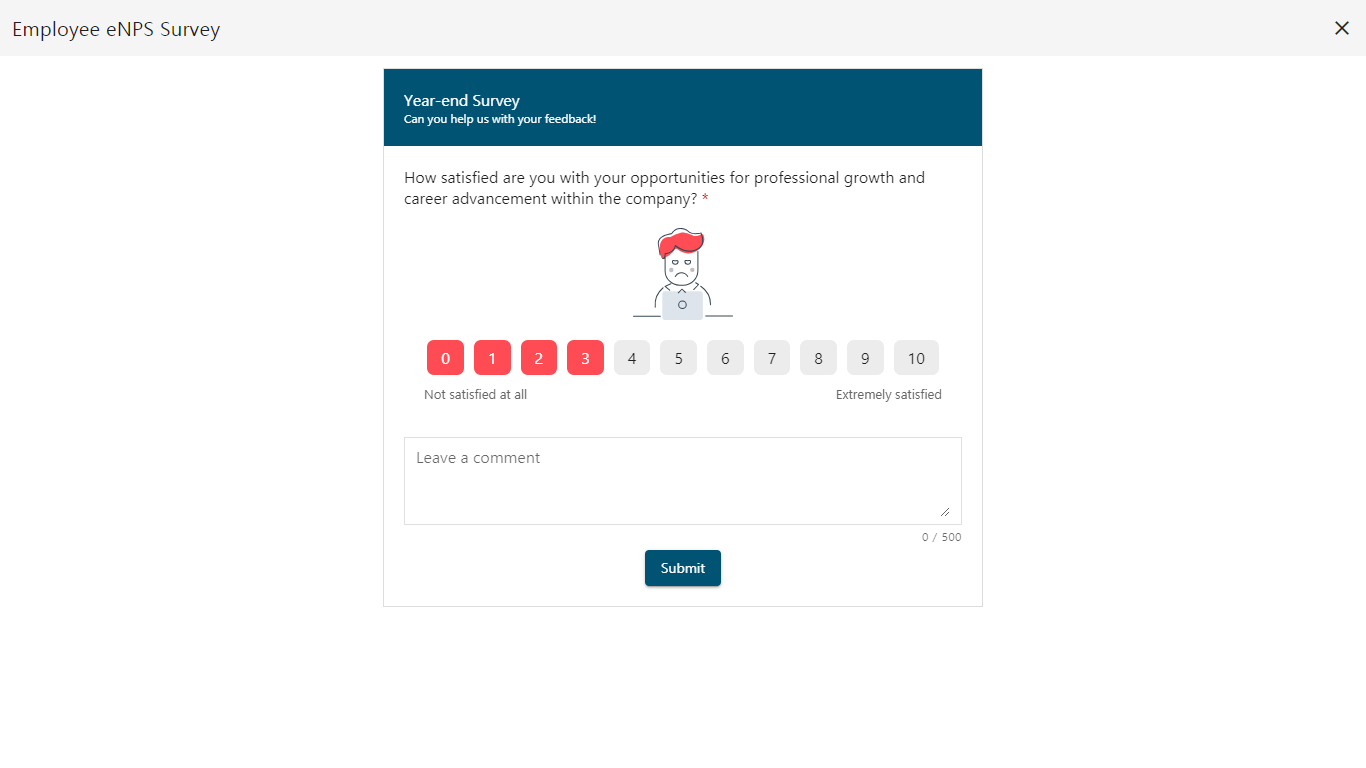
- If Anonymity is enabled, this will be indicated at the bottom of the survey.
- Once the survey is completed, its status will change from Ongoing to Completed under the eNPS Info tab.
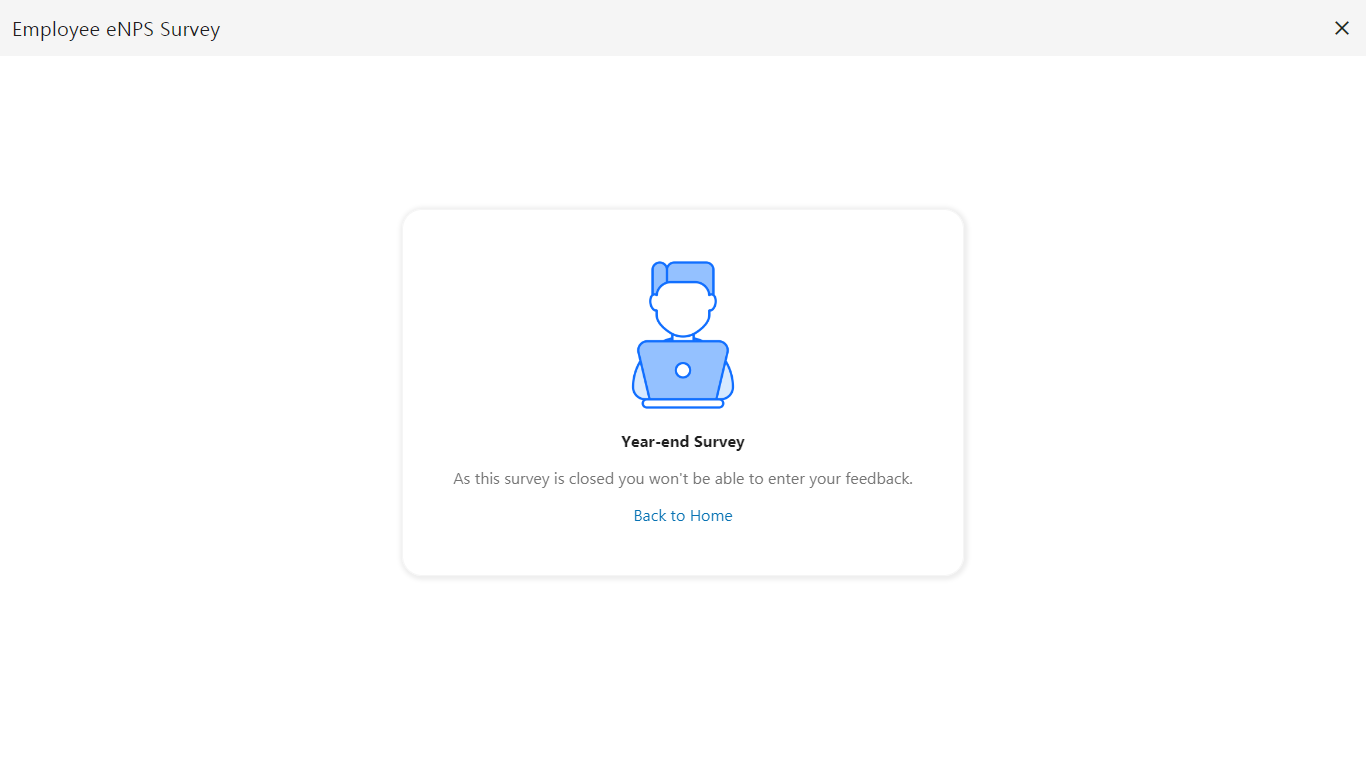
- If an employee does not complete the survey within the designated time frame, it will no longer be accessible, and a note will appear stating that the time has expired.
- Employees who are not eligible will not be able to view or answer the survey.
eNPS Analytics
eNPS Score Analysis
- Navigate to the eNPS Analytics tab to analyze the eNPS score and comment feedback from the survey.
- Select a specific survey name from the drop-down menu.
- Choose the corresponding survey date from the next drop-down.
- Click the Apply button to view the full analytics for that survey, or click Reset to clear the filters.
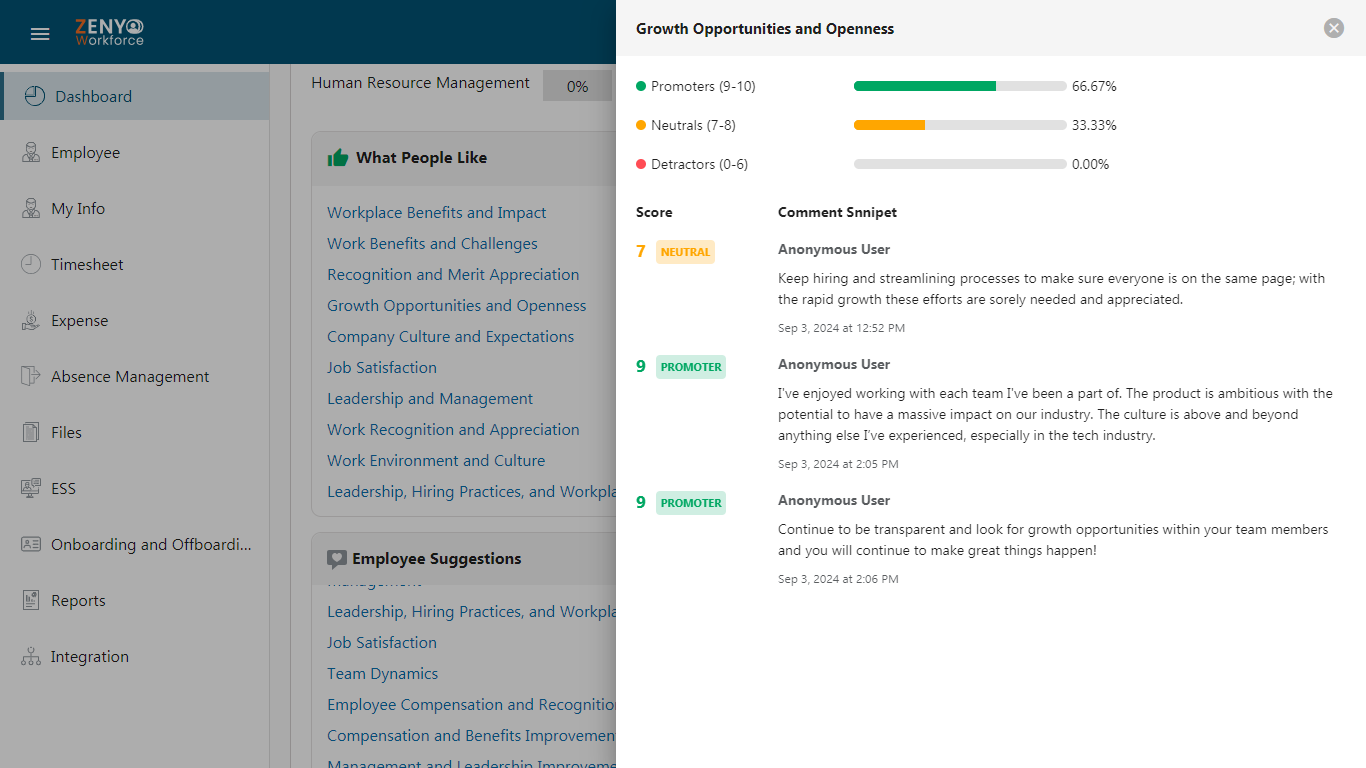
- Responses are categorized into three groups:
- Promoters (9-10): Employees who give positive feedback.
- Neutrals (7-8): Employees who are satisfied but not enthusiastic. Neutrals are not counted.
- Detractors (0–6): Employees who provide negative feedback.
- The eNPS Score is calculated using the formula: eNPS = % of Promoters - % of Detractors, with a range from -100 to +100.
- An Arrow icon next to the eNPS Score indicates:
- Green indicates improvement in the eNPS score compared to the previous survey.
- Red indicates a lower score compared to the past survey.
- The total eNPS score is displayed.
- Below the score, the percentage increase or decrease from the previous survey date is shown.
- Below, the total responses for this survey are displayed, showing the overall participation rate.
- Promoters, Neutrals, and Detractors scores are displayed individually in the same way.
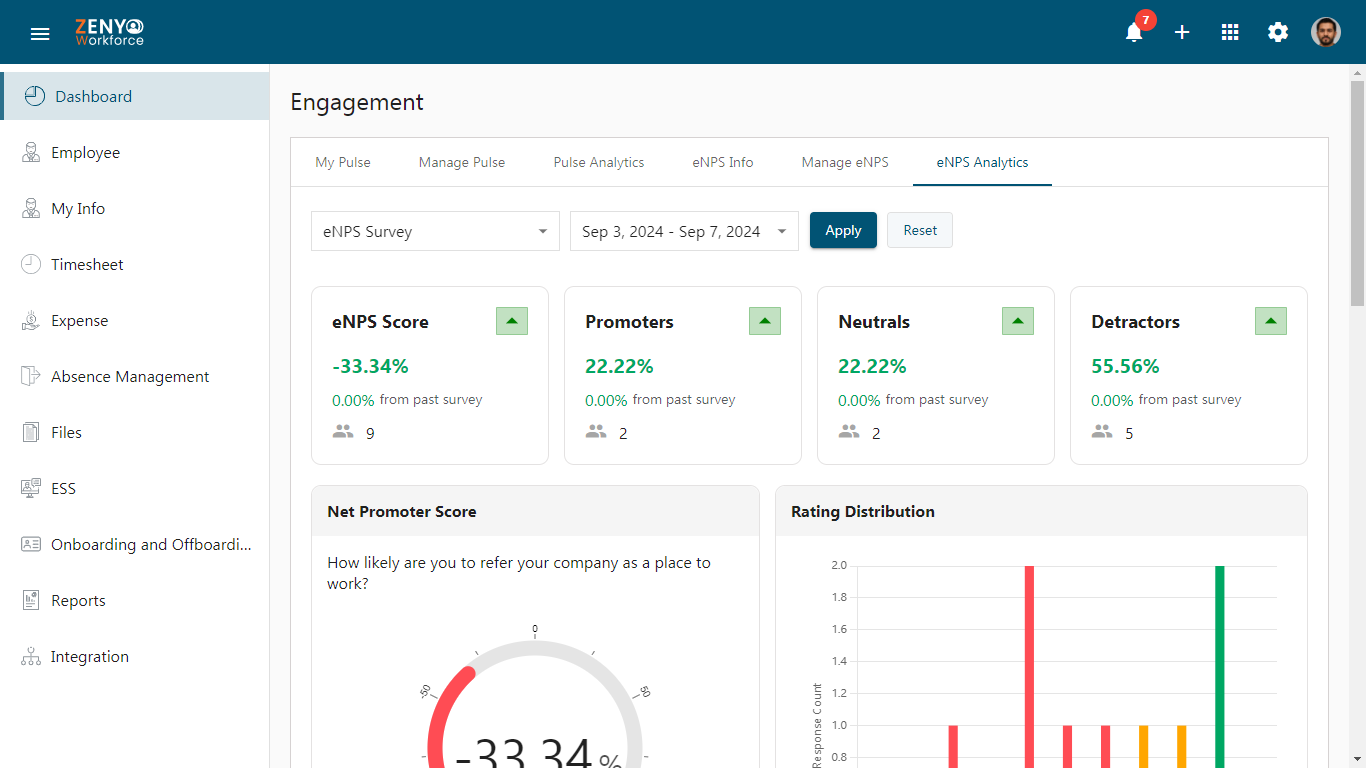
- The Net Promoter Score section displays the survey question along with the overall eNPS score, which ranges from -100 to +100.
- A detailed percentage breakdown of Detractors (those rating 0-6), Neutrals (those rating 7-8), and Promoters (those rating 9-10) is provided.
- The Rating Distribution chart shows the number of responses for each rating on the 10-point scale, helping you quickly see how employees rated the survey.
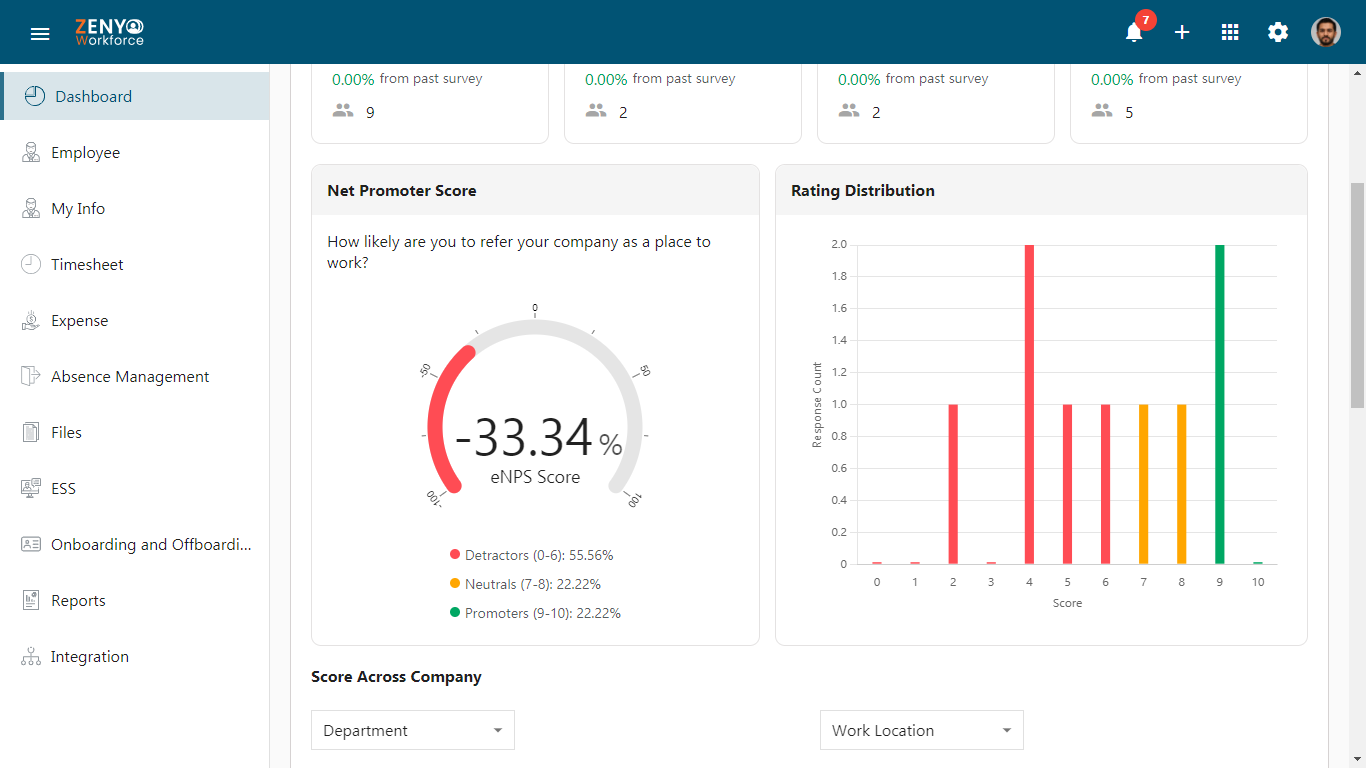
- The Score Across Company section gives a percentage breakdown of eNPS scores across 4 different categories within a company, such as Department, Role, Employment Type, and Work Location.
- For example, if you select Department, it will display the eNPS score for each department within the company.
- Each department will have a bar with color-coded sections representing the percentages of Promoters (green), Neutrals (yellow), and Detractors (red).
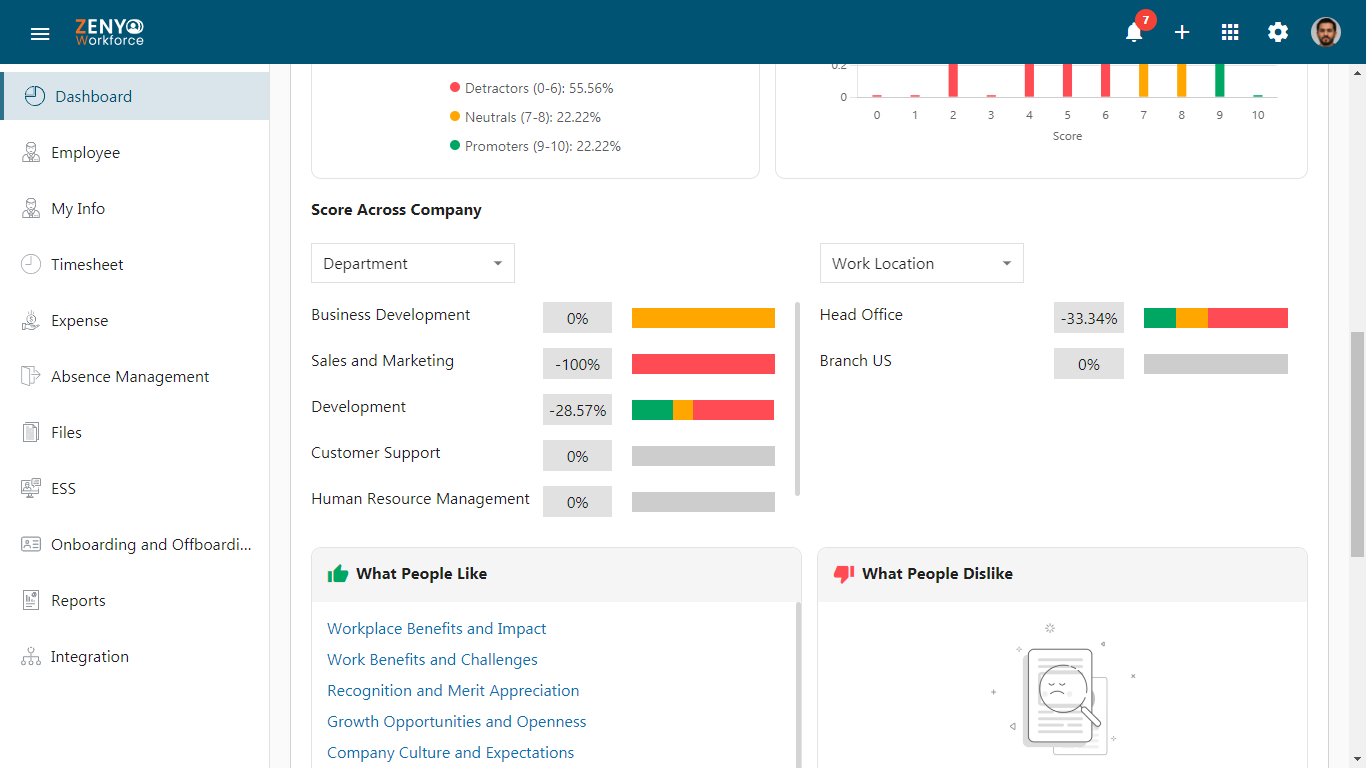
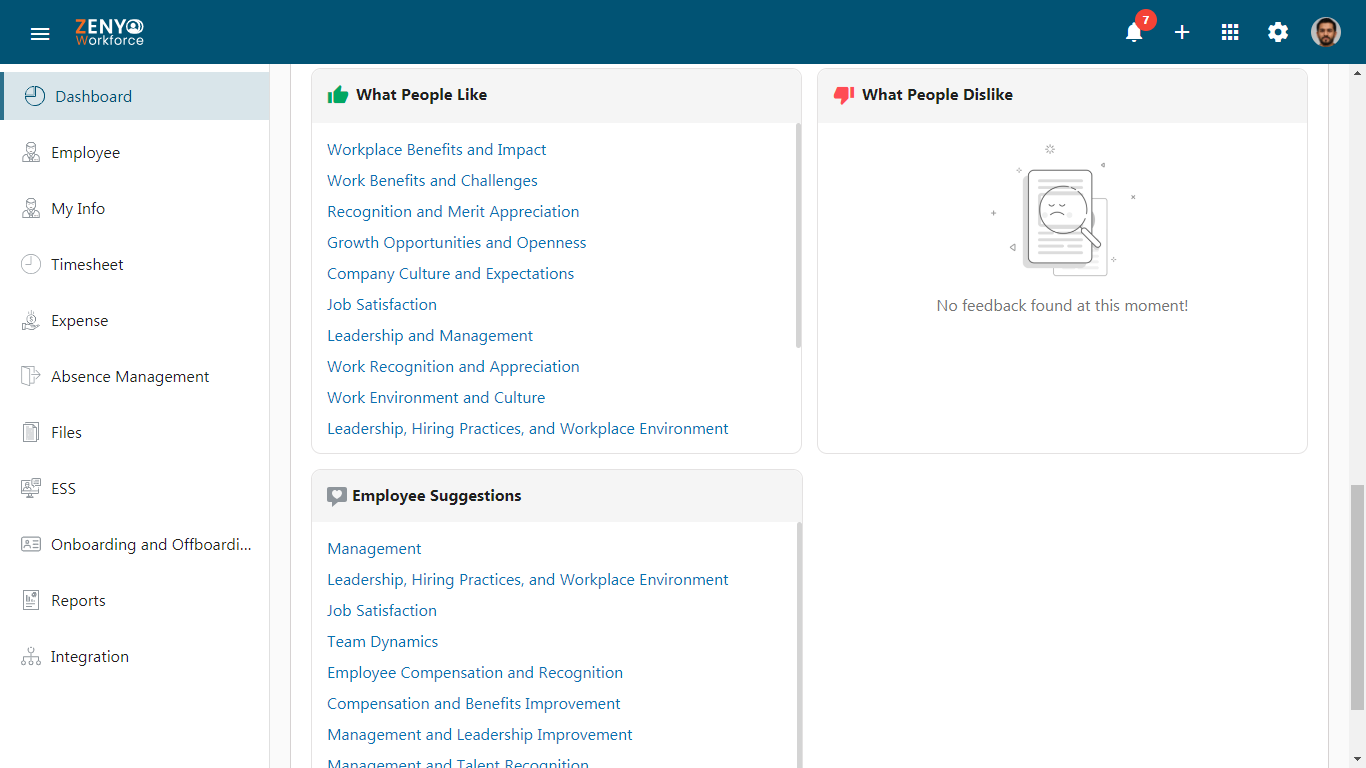
Sentiment Analysis
- The sentiment analysis process works by categorizing comments into Positive, Negative, and Neutral sections based on predefined categories.
- The system divides employee comments into three sentiment categories: What People Like (positive), What People Dislike (negative), and Employee Suggestions (neutral).
- Each of these preloaded categories contains a set of related terms. These terms will have a set of predefined keywords associated with them.
- When an employee submits a comment, the system analyzes the text for those predefined keywords and categorizes the comment into one of three sentiment categories.
- When you click on a specific term, a detailed breakdown will be displayed.
- You can view the employee comments categorized under the selected term.
- Each comment is labeled as a Promoter, Neutral, or Detractor based on the 10-point scale scoring.
- Additionally, the overall score percentages for Promoters, Neutrals, and Detractors will be presented.